AI Agent Observability: How to Monitor and Debug AI Agents in Production
Learn how to implement observability for AI agents in production. Discover tools, metrics, and best practices for monitoring, debugging, and optimizing autonomous agents.

You've built an AI agent and deployed it to production. Now comes the hard part: keeping it running reliably. Without proper observability, you're flying blind—unable to understand why agents fail, where they're slow, or what they're costing you. AI agent observability is the practice of instrumenting your agentic systems so you can monitor, debug, and optimize them effectively.
What is AI Agent Observability?
AI agent observability goes beyond traditional application monitoring. It's the ability to understand the internal state and behavior of your AI agents based on their external outputs. This includes:
- What decisions is the agent making? (reasoning traces)
- Why did it make those decisions? (context, prompts, retrieved data)
- How long is each step taking? (latency breakdown)
- What is it costing? (token usage, API calls)
- Is it working correctly? (error rates, quality metrics)
Without observability, debugging AI agents is like trying to fix a car with the hood welded shut.
Why AI Agent Observability is Critical
1. AI Agents Are Non-Deterministic
Unlike traditional software that follows the same code path every time, AI agents can behave differently on each run. The same input might produce different outputs depending on model updates, context, or sampling parameters.
2. Failures Are Often Silent
An agent might complete successfully but produce incorrect results. Traditional monitoring (uptime, error rates) won't catch these quality failures.
3. Debugging is Exponentially Harder
With multi-agent systems, a failure could happen anywhere:
- Wrong agent selected
- Incorrect context retrieved
- Model hallucination
- Tool execution failure
- State management bug
Without observability, finding the root cause is nearly impossible.
4. Cost Can Spiral Out of Control
One misbehaving agent could burn through thousands of dollars in API calls before you notice. Real-time cost tracking is essential.
5. Quality Degrades Silently
Model providers update their models. Your prompts that worked yesterday might perform poorly today. Without monitoring quality metrics, you won't know until users complain.
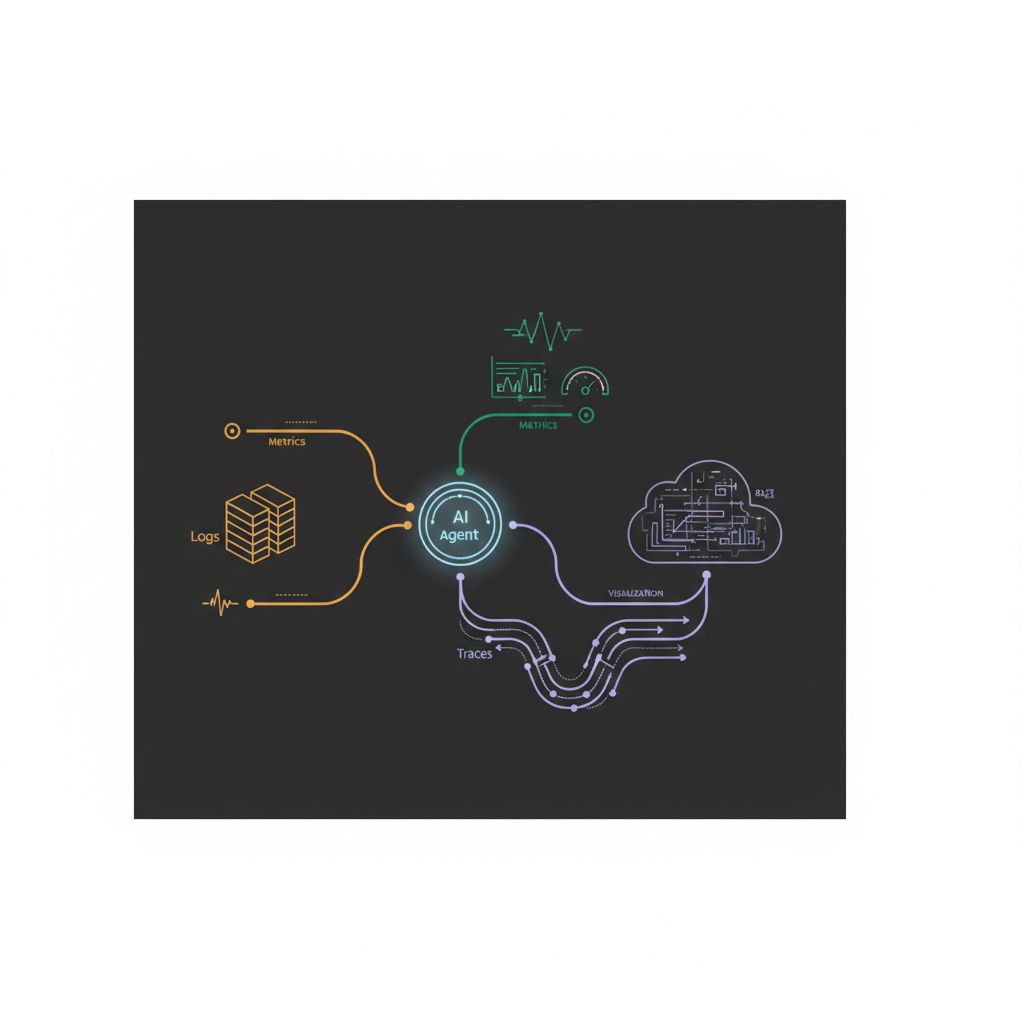
The Three Pillars of AI Agent Observability
1. Traces: What Happened?
Traces show the complete path of execution for each agent run:
- Which agents were invoked
- What prompts were sent
- Which tools were called
- What context was retrieved
- All intermediate outputs
Key metrics:
- Total execution time
- Time per agent/step
- Number of LLM calls
- Number of tool invocations
- Total tokens used
2. Metrics: How is it Performing?
Aggregated statistics across all agent runs:
- Success vs. error rate
- P50/P95/P99 latency
- Cost per request
- Tokens per request
- Tool usage patterns
Key metrics:
- Requests per minute
- Error rate by error type
- Average cost per conversation
- Cache hit rate
- Model distribution (which models are being used)
3. Logs: Why Did it Fail?
Detailed context for debugging specific failures:
- Full error messages
- Stack traces
- Input that caused the failure
- Agent state at failure time
- Related trace ID for correlation
Key data:
- Structured logs with consistent fields
- Correlation IDs across distributed traces
- User ID and session ID
- Environment and version tags
For broader context on building production agents, see our guide on how to build AI agents for your business.
Essential Metrics to Track
Quality Metrics
1. Task Success Rate Did the agent complete the task successfully?
- Track by agent type
- Track by user intent
- Set alerts for drops
2. User Satisfaction
- Explicit feedback (thumbs up/down)
- Implicit signals (conversation length, escalations to humans)
- Follow-up questions (indicates initial response was inadequate)
3. Hallucination Rate
- Use LLM-as-judge to detect factual errors
- Compare against ground truth when available
- Track by topic/domain
4. Response Relevance
- Semantic similarity to expected outputs
- Coverage of user query
- Presence of required information
Performance Metrics
1. End-to-End Latency
- P50, P95, P99
- Broken down by agent/step
- Time to first token (for streaming)
2. Individual Component Latency
- LLM inference time
- RAG retrieval time
- Tool execution time
- Network latency
3. Throughput
- Requests per second
- Concurrent agent executions
- Queue depth (if using async processing)
Cost Metrics
1. Cost per Request
- Total API costs
- Broken down by model
- Infrastructure costs
2. Token Usage
- Input tokens vs output tokens
- By model type
- By agent/step
3. Cache Hit Rate
- Prompt caching effectiveness
- Semantic caching (if used)
- Cost savings from caching
Reliability Metrics
1. Error Rate
- By error type (rate limit, timeout, model error, tool error)
- By agent
- By user segment
2. Retry Rate
- How often do automatic retries succeed?
- Are certain operations retrying excessively?
3. Circuit Breaker Trips
- How often do circuit breakers trigger?
- Which services are failing?
For more on agent reliability, check out AI agent security best practices.
Tools for AI Agent Observability
LangSmith (LangChain)
Best for: Teams already using LangChain/LangGraph
Features:
- Automatic trace capture for LangChain applications
- Prompt playground for testing
- Dataset management for evaluation
- LLM-as-judge evaluation
Pros: Deep integration, easy setup if you're in the LangChain ecosystem Cons: Tied to LangChain, pricing can scale quickly
LangFuse
Best for: Open-source alternative with flexibility
Features:
- Open-source, self-hostable
- Framework-agnostic (works with any LLM stack)
- Prompt management and versioning
- Cost tracking and analytics
Pros: Free (self-hosted), flexible, good community Cons: Requires more setup than managed options
Arize AI / Phoenix
Best for: ML teams wanting production ML monitoring
Features:
- Embeddings analysis and clustering
- Drift detection
- Model performance tracking
- Integration with traditional ML monitoring
Pros: Powerful analytics, great for complex ML systems Cons: Heavier weight, higher learning curve
Helicone
Best for: Simple proxy-based monitoring
Features:
- Drop-in proxy for OpenAI/Anthropic APIs
- No code changes needed
- Caching, rate limiting, load balancing
- Cost tracking
Pros: Easiest to add (just change API endpoint), good caching Cons: Limited to proxy-able APIs, less visibility into agent internals
Weights & Biases (W&B)
Best for: Teams already using W&B for ML training
Features:
- Prompt tracking and versioning
- A/B testing for prompts
- Integration with training workflows
- Strong visualization tools
Pros: If you're already using W&B, natural extension Cons: Overkill if you only need agent observability
Build Your Own Stack
Many production teams build custom observability:
Typical stack:
- Tracing: OpenTelemetry + Jaeger/Tempo
- Metrics: Prometheus + Grafana
- Logs: Elasticsearch/Loki + Grafana
- Custom dashboards: Grafana or internal tools
Pros: Maximum flexibility, no vendor lock-in, control costs Cons: Requires engineering time, maintenance burden
For framework-specific considerations, see our AI agent framework comparison.
Best Practices for AI Agent Observability
1. Instrument from Day One
Don't wait until you have production issues. Add observability in your prototype:
- Log every LLM call (prompt + response)
- Track latency for each step
- Capture errors with full context
It's much harder to add after the fact.
2. Use Structured Logging
Don't log raw strings. Use structured logs (JSON) with consistent fields:
{
  "timestamp": "2026-03-26T11:00:00Z",
  "level": "info",
  "trace_id": "abc123",
  "agent": "customer-support",
  "event": "llm_call",
  "model": "gpt-4o",
  "input_tokens": 1250,
  "output_tokens": 420,
  "latency_ms": 2340,
  "cost_usd": 0.042
}
This makes querying and aggregation trivial.
3. Sample Intelligently
You don't need to log every detail for every request:
- Errors: Always log 100%
- Slow requests: Always log (P95+)
- Normal requests: Sample (1-10%)
- Prompts/responses: Sample or log hashes for privacy
This reduces costs while maintaining debuggability.
4. Set Up Alerts for Anomalies
Critical alerts:
- Error rate > 5%
- P95 latency > 2x baseline
- Cost per request > 2x baseline
- Success rate < 80%
Warning alerts:
- Cost trending upward week-over-week
- Quality metrics declining
- New error types appearing
5. Build Quality Evaluation Pipelines
Automatically evaluate agent outputs:
- Run LLM-as-judge on sample of responses
- Compare against golden datasets
- Track metrics over time
- Alert when quality drops
Don't rely on users to catch quality issues.
6. Version Everything
Track versions for:
- Prompts (git commit or hash)
- Models (model name + date)
- Agent code (git commit)
- Dependencies (requirements.txt hash)
When debugging, you need to know exactly what version was running.
7. Use Correlation IDs
Every user request should have a unique ID that flows through:
- All logs
- All traces
- All metrics
- Error reports
This lets you reconstruct the complete story of a request.
8. Monitor Costs in Real-Time
Don't wait for the bill:
- Track spend per request
- Set daily/weekly budgets
- Alert when approaching limits
- Implement circuit breakers for cost overruns
9. Capture Failure Context
When an agent fails, log:
- The full input that triggered it
- The state of the agent
- What step it failed on
- The exact error
- All relevant context (user ID, session, etc.)
You should be able to reproduce any failure.
10. Review Traces Regularly
Don't just set up dashboards and forget them:
- Weekly review of sample traces
- Look for inefficiencies (unnecessary calls, redundant steps)
- Identify optimization opportunities
- Spot patterns in failures
For testing strategies that complement observability, see our AI agent testing guide.
Common Observability Mistakes
1. Logging Too Much Sensitive Data
Problem: Logs contain PII, passwords, API keys Solution: Sanitize logs, use hashing for identifiers, implement log retention policies
2. High Cardinality Metrics
Problem: Creating metrics with dimensions like user_id causes metric explosion Solution: Use traces/logs for high cardinality data, keep metrics aggregated
3. No Cost Attribution
Problem: Can't tell which agents/users are driving costs Solution: Tag every request with agent, user_tier, and feature
4. Ignoring Tail Latency
Problem: Focusing on average latency while P99 is terrible Solution: Always track P95 and P99, set SLOs based on percentiles
5. Alert Fatigue
Problem: Too many alerts that are ignored Solution: Start with critical alerts only, tune thresholds based on real patterns
Real-World Example: Customer Support Agent
Setup:
- Multi-agent system (routing, knowledge retrieval, response generation)
- 10,000 conversations per day
- Complex failure modes
Observability implementation:
-
Every conversation gets a trace_id that flows through all agents
-
Key metrics tracked:
- Resolution rate (did we solve the problem?)
- Escalation rate (handed off to human?)
- Response time (P50/P95)
- Cost per conversation
- User satisfaction (explicit feedback)
-
Quality monitoring:
- LLM-as-judge evaluates 5% of responses
- Flags hallucinations, irrelevant responses, policy violations
- Weekly human review of flagged responses
-
Cost tracking:
- Real-time dashboard showing today's spend vs budget
- Breakdown by agent and model
- Alerts when approaching daily limit
-
Alerting:
- PagerDuty alert if error rate > 5% for 5 minutes
- Slack notification if P95 latency > 10 seconds
- Daily summary of quality metrics
Result:
- Caught a prompt regression within 2 hours (quality drop)
- Identified a caching opportunity saving $800/day
- Reduced P95 latency by 40% by optimizing retrieval
- Zero production incidents in 6 months
Getting Started Checklist
Week 1: Basic instrumentation
- Add structured logging for all LLM calls
- Track latency for each step
- Capture all errors with context
- Generate unique trace IDs
Week 2: Metrics and dashboards
- Set up metrics collection (Prometheus/CloudWatch)
- Build basic dashboard (error rate, latency, cost)
- Add cost tracking
Week 3: Tracing
- Implement distributed tracing (OpenTelemetry recommended)
- Connect logs to traces via correlation IDs
- Set up trace visualization (Jaeger/LangSmith)
Week 4: Quality monitoring
- Implement LLM-as-judge for quality evaluation
- Create golden test dataset
- Set up automated quality tests
Month 2: Alerts and optimization
- Define SLOs (error rate, latency, quality)
- Set up critical alerts
- Review traces weekly for optimization opportunities
- Document playbooks for common failures
The Future of AI Agent Observability
As agents become more complex, observability will evolve:
Automated root cause analysis using AI to diagnose failures
Predictive monitoring that alerts before failures happen
Self-healing agents that automatically adjust based on observability data
Multi-modal observability tracking not just text but images, audio, actions
Privacy-preserving observability with techniques like differential privacy and federated learning
The teams that invest in observability now will be able to scale agent systems confidently while others struggle with mysterious failures and spiraling costs.
Build AI That Works For Your Business
At AI Agents Plus, we help companies move from AI experiments to production systems that deliver real ROI. Whether you need:
- Custom AI Agents — Autonomous systems that handle complex workflows, from customer service to operations
- Rapid AI Prototyping — Go from idea to working demo in days using vibe coding and modern AI frameworks
- Voice AI Solutions — Natural conversational interfaces for your products and services
We've built AI systems for startups and enterprises across Africa and beyond.
Ready to explore what AI can do for your business? Let's talk →
About AI Agents Plus Editorial
AI automation expert and thought leader in business transformation through artificial intelligence.


